SSAT Math Question 531: Answer and Explanation
Home > SSAT Test > SSAT Math Practice Tests
Test Information
- Use your browser's back button to return to your test results.
- Do more SSAT Math Practice Tests.
Question: 531
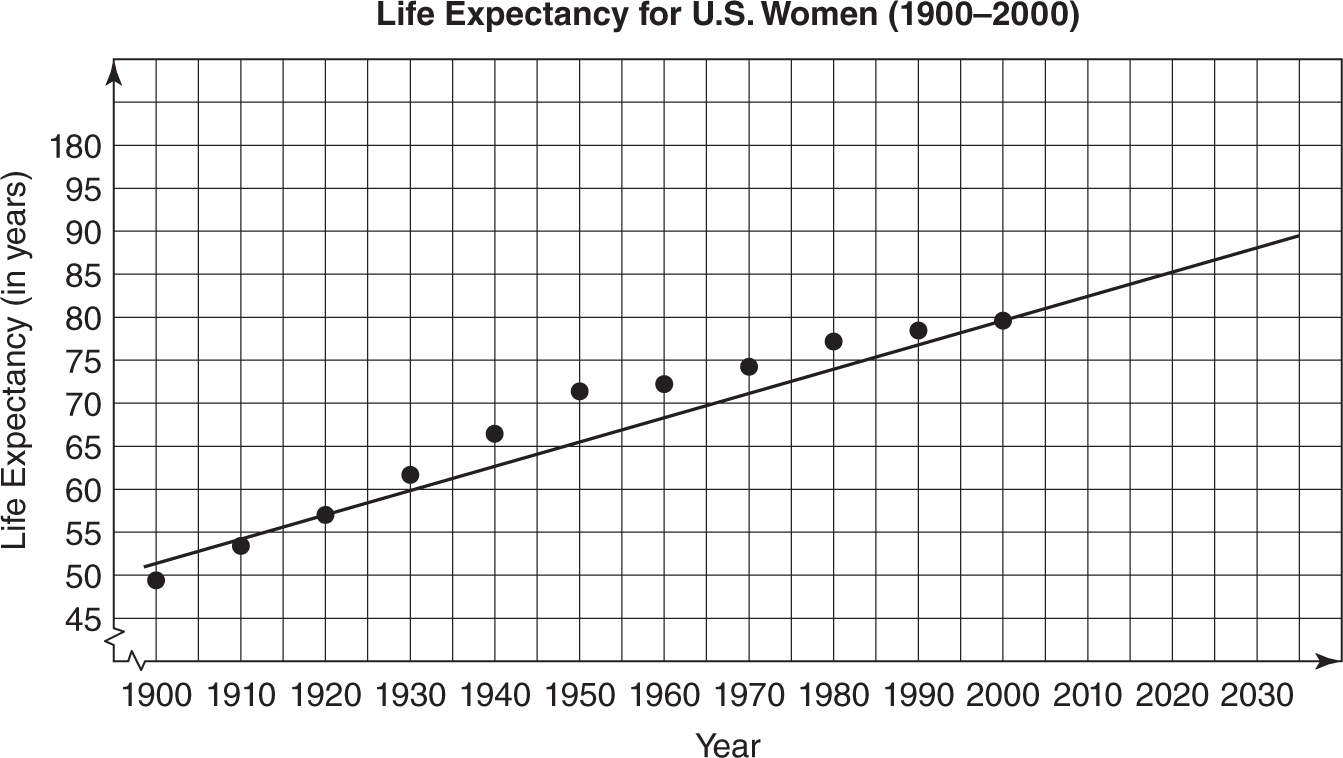
5. Based on the scatter plot and line of best fit shown below, about how many years is the likely life expectancy for women in the United States in year 2020?
- A. 77
- B. 79
- C. 80
- D. 85
Correct Answer: D
Explanation:
D is correct. Find 2020 along the horizontal axis and then read the number that corresponds to the vertical axis. This life expectancy is about 85 years.