SSAT Math Question 335: Answer and Explanation
Home > SSAT Test > SSAT Math Practice Tests
Test Information
- Use your browser's back button to return to your test results.
- Do more SSAT Math Practice Tests.
Question: 335
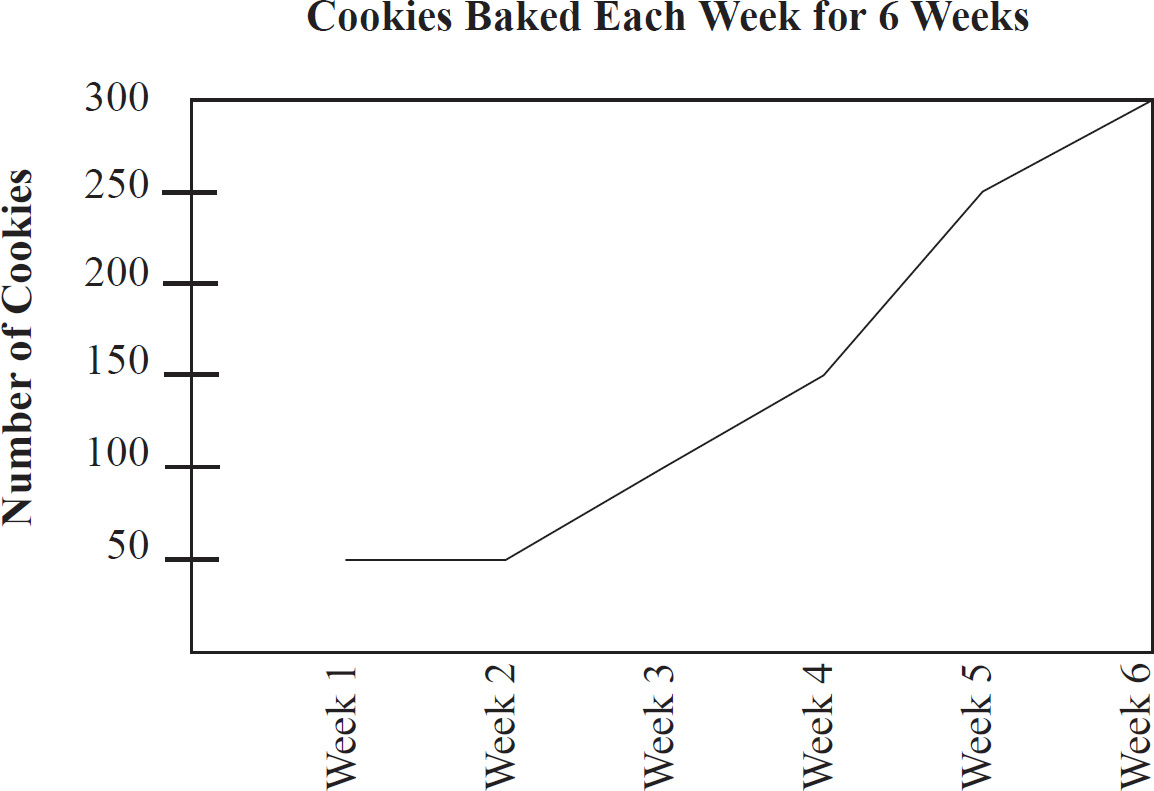
4. According to the graph in the figure, in which week was the greatest increase in the number of cookies baked compared to the week before?
Cookies Baked Each Week for 6 Weeks
- A. Week 2
- B. Week 3
- C. Week 4
- D. Week 5
Correct Answer: D
Explanation:
The answer is D
The greatest increase from one week to the next will show the steepest slope on the graph. In Week 4, 150 cookies were baked, but in Week 5, 250 cookies were baked, an increase of 100. That is the largest of any of the weekly increases.