ISEE Word Problems Question 293: Answer and Explanation
Home > ISEE Test > ISEE Word Problems Practice Tests
Test Information
- Use your browser's back button to return to your test results.
- Do more ISEE Word Problems Practice Tests.
Question: 293
12. The box-and-whisker plot below shows the number of days without sunlight in a remote village in northern Alaska during winter last year.
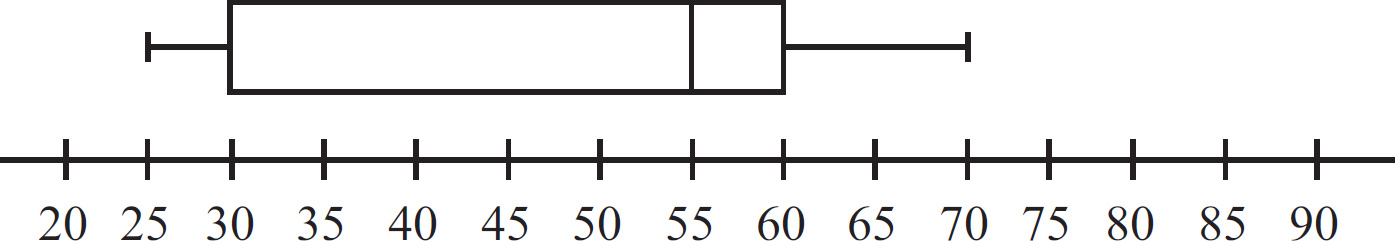
What is the range of the data?
- A. 30
- B. 45
- C. 55
- D. 70
Correct Answer: B
Explanation:
B
The vertical lines at either end of the box-and-whisker graph represent the lowest and highest data points. (The vertical line in the middle of the two boxes represents the median.) As range is calculated by subtracting the lowest value from the highest value, the range here is 70 – 25 = 45.