ISEE Word Problems Question 234: Answer and Explanation
Home > ISEE Test > ISEE Word Problems Practice Tests
Test Information
- Use your browser's back button to return to your test results.
- Do more ISEE Word Problems Practice Tests.
Question: 234
14. The box-and-whisker plot below represents the low temperature, in degrees Fahrenheit, at a particular location on the same day in February for the last 50 years.
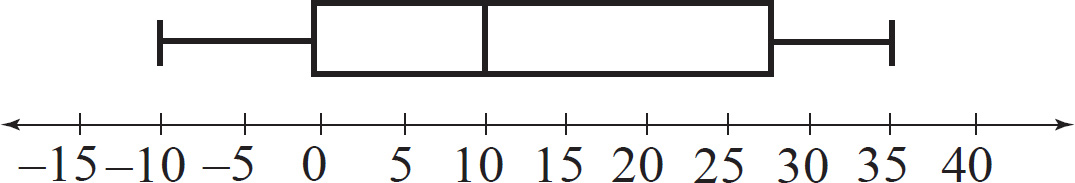
What is the range of the data?
- A. 65
- B. 45
- C. 35
- D. 15
Correct Answer: B
Explanation:
The answer is B
The vertical lines at either end of the box-and-whisker graph represent the lowest and highest data points. (The vertical line in the middle of the two boxes represents the median.) As range is calculated by subtracting the lowest value from the high value, the range here is 35 - (-10) = 45.