ISEE Quantitative Comparisons Question 171: Answer and Explanation
Home > ISEE Test > ISEE Quantitative Comparisons Practice Tests
Test Information
- Use your browser's back button to return to your test results.
- Do more ISEE Quantitative Comparisons Practice Tests.
Question: 171
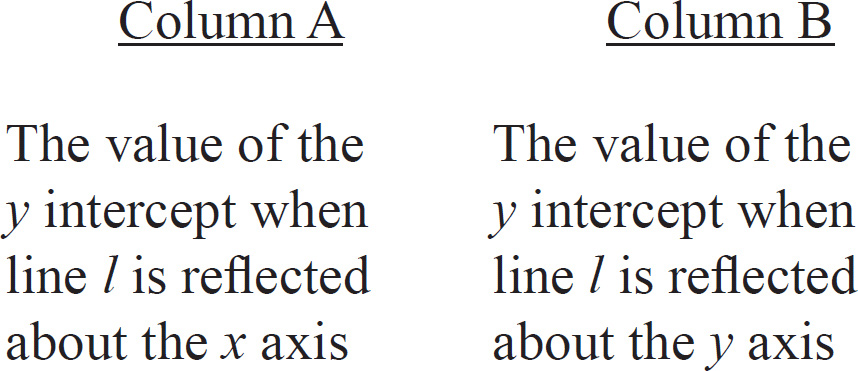
12. Line l is the graph of y = 2x + 3.
- A. The quantity in Column A is greater.
- B. The quantity in Column B is greater.
- C. The two quantities are equal.
- D. The relationship cannot be determined from the information given.
Correct Answer: B
Explanation:
B
In the figure, the x intercept is –2, and the y intercept is 3. When a line is reflected about the x axis, the x intercept stays the same, but the sign of the y intercept reverses. Thus, the value of Column A is –3. When a line is reflected about the y axis, the sign of the x intercept reverses, but the y intercept stays the same. Thus, the value of Column B is 3.