ISEE Quantitative Comparisons Question 153: Answer and Explanation
Home > ISEE Test > ISEE Quantitative Comparisons Practice Tests
Test Information
- Use your browser's back button to return to your test results.
- Do more ISEE Quantitative Comparisons Practice Tests.
Question: 153
4. The histogram shows exam scores of students in a history class.
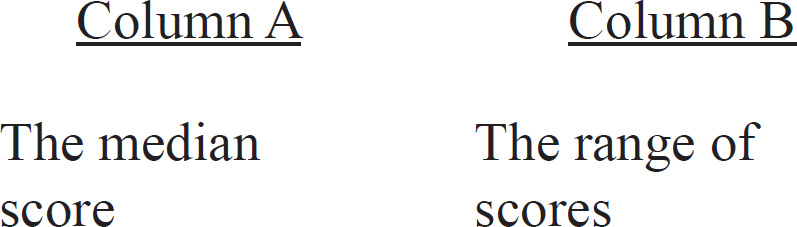
- A. The quantity in Column A is greater.
- B. The quantity in Column B is greater.
- C. The two quantities are equal.
- D. The relationship cannot be determined from the information given.
Correct Answer: A
Explanation:
The answer is A
The exact scores are not provided, but you can figure out the largest possible range by subtracting the smallest possible value from the largest possible value: 100 - 51 = 49. While we do not know the median, it must be greater than 51 (the lowest possible data point), so the median is greater.